From the first day of 2026, official statistics revealed a profound transformation in our national infrastructure for electric vehicles. The Department for Transport's update didn't just tweak numbers; it fundamentally altered how every driver interacts with the network.
This shift was cemented in February when new terminology for power bands was introduced. The goal was crystal clear: to cut through confusion and provide unambiguous information for all motorists.
I have created this comprehensive guide to help you navigate these complex changes. The adjustments move the focus from simply counting physical units to understanding the actual power available to you.
My analysis breaks down what this transition means in practical terms. You will learn exactly how these fresh categorisations impact your daily routine, whether you're on a long journey or a regular commute.
The industry's move towards a uniform system is a significant step. This guide provides the essential knowledge for anyone who depends on public charging to keep their car running smoothly.
Key Takeaways
- This guide demystifies the complex new categorisations for power bands introduced in 2026.
- Government data from January 2026 updated how public charging infrastructure is categorised.
- The analysis focuses on the shift from measuring devices to counting available chargers.
- You will learn how the new labels affect your daily charging habits and planning.
- The industry's move towards standardised terminology across the network is explained.
- Essential information is provided for drivers who rely on public charging points.
- Understand the practical difference between the new Standard and Standard Plus designations.
Introduction
I've created this resource to provide clarity on the significant shifts in how public refuelling infrastructure is now reported. The Department for Transport offers detailed statistics on its official government website page, which forms the basis for our analysis.
This guide serves as a central hub. It helps you understand how the growth of publicly accessible power points is tracked across our country.
My goal is to break down complex government data into simple, actionable insights. This will help you make informed decisions about your vehicle's energy requirements.
Purpose of the Ultimate Guide
The core aim here is to demystify a major change in reporting metrics. This change, implemented in early 2026, fundamentally altered how we view the national network.
I will provide clear information on what this shift means for you as a driver. We'll move beyond counting physical units to grasping actual available power.
Key Topics and Takeaways
By the end, you'll have a comprehensive understanding of the new power bands and their practical implications. We'll explore the rationale behind the updated terminology and its effect on daily planning.
You'll learn how to interpret the latest statistics with confidence. This knowledge is essential for anyone relying on the public network to keep moving.
Historical Evolution of UK EV Charging Infrastructure
A closer look at the historical data shows a pivotal shift in how we quantify infrastructure growth. Since 2014, the Department for Transport has monitored the expansion of our national network. They initially relied on counting charging devices as the primary metric.
This count was used to gauge the scale of the developing charging infrastructure. For years, this was the accepted way to track progress.
Reporting Shifts Over Time
The industry previously used the number of charging devices as a proxy for total capacity. This method had a significant flaw. It often failed to show how many cars could actually power up at the same time.
The shift in reporting was driven by a need for greater accuracy. It moved the focus from simply counting hardware to understanding real availability.
From Charging Devices to EV Chargers
By 1 January 2026, official figures highlighted a clear disparity. The data recorded 116,052 EV chargers, compared to just 87,796 charging devices.
This evolution marks a maturation in data standards. It provides a much truer picture of what our current public charging infrastructure can actually support for drivers.
Exploring UK EV charging labels 2026 standard plus
The terminology used to categorise public power points underwent a significant overhaul last year. This shift was designed to replace older, potentially misleading descriptions that could confuse motorists.
Clarifying the New Terminology
The introduction of fresh designations in February 2026 aims to provide a clearer understanding of the power delivered by each unit. I want to clarify that these categories are designed to help every electric car owner identify the performance they can expect from a specific point.
By moving away from terms like 'slow' and 'fast', the government ensures that the power rating becomes the primary focus for every motorist. This change prioritises technical accuracy over subjective speed impressions, which varied between users.
You will notice that these new designations are now used consistently across the industry. They describe the capabilities of each individual power point in a uniform way, creating a common language for all providers.
Understanding these categories is essential for any driver who wants to optimise their charging time at various public locations. It allows for better journey planning and reduces range anxiety significantly.
EV Chargers vs Charging Devices: A New Metric
Statistical reporting underwent a crucial transformation, prioritising actual service capacity over mere hardware counts. This shift fundamentally changed how we understand the scale of our national refuelling network.
The old method focused on counting physical charging devices. However, this often failed to show true availability for motorists.
Advantages of Counting EV Chargers
Tracking individual chargers provides a more accurate picture. Each unit typically controls one vehicle session at a time.
This approach directly reflects simultaneous charging capacity. I find it offers a clearer metric than the previous count of charging devices.
The change also enables better international comparisons. Many countries now use this charger count to assess their infrastructure growth.
Impact on Measuring Public Charging Availability
The impact on assessing public charging is substantial. Data from early 2026 showed a ratio of 1.32 chargers for every charging device.
This proves the old number charging devices metric under-represented true capacity. One physical unit could host multiple internal chargers.
By focusing on the number charging devices and their actual chargers, authorities provide a more reliable assessment. This helps drivers plan journeys with greater confidence.
Power Band Classifications and Their Implications
Categorising power output into distinct bands helps drivers quickly identify the right charger for their needs. This system clarifies what each point can deliver for your car.
It moves beyond vague terms to offer precise technical ratings. This allows for better planning and reduces confusion at the point of use.
Understanding Standard vs Standard Plus
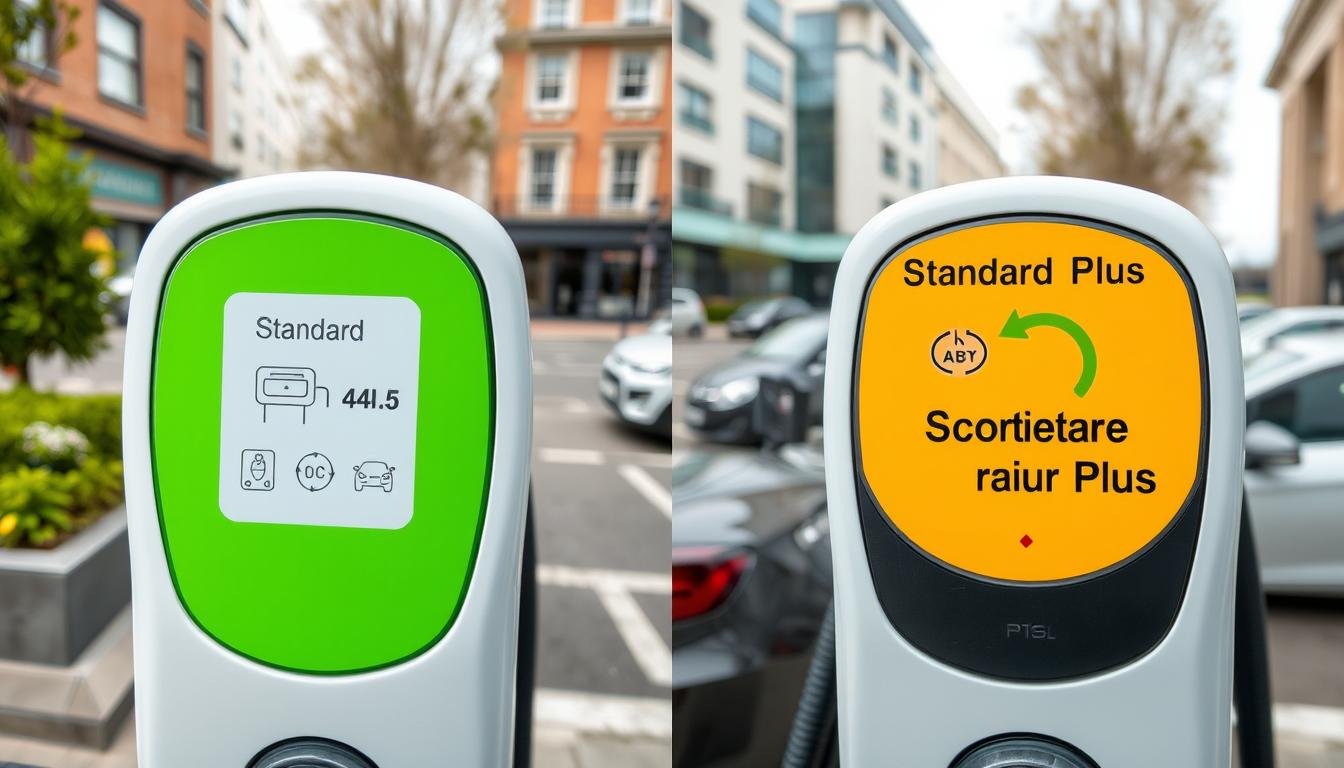
The Standard band covers 3kW to less than 8kW. It suits long stays where your vehicle's battery can fill slowly.
Standard Plus ranges from 8kW to under 50kW. This medium level fits shopping or leisure trips. Both categories serve different journey patterns effectively.
Comparing Rapid and Ultra-Rapid Categories
Rapid units deliver 50kW to less than 150kW. They are for short stops when you need a quick boost.
Ultra-rapid points offer 150kW or more. They provide the highest power to minimise waiting time. These are often found on major routes.
| Power Band | Power Range | Ideal Use Case |
|---|---|---|
| Standard | 3kW to | Long-stay charging |
| Standard Plus | 8kW to | Medium-duration trips |
| Rapid | 50kW to | Quick battery top-up |
| Ultra-Rapid | 150kW+ | Minimum charging time |
I must note that the power delivered to your vehicle may vary. Factors include the battery management system and available grid capacity.
Geographical Distribution of EV Chargers
The location of public refuelling points is not random but follows distinct demographic trends. Understanding where this infrastructure is concentrated helps explain current access and future needs.
Regional Variations Across the UK
Regional data shows a varied picture. London has a high number of chargers per person.
Much of this consists of standard on-street units. This affects the mix of power available to drivers in the capital.
In contrast, Scotland reported 217.5 chargers per 100,000 people in early 2026. Northern Ireland's figure was notably lower at 57.5.
Urban and Rural Charging Statistics
The split between city and countryside locations is revealing. Urban areas hosted 82.9% of all charging infrastructure.
This aligns with 82.5% of the population living there. Rural regions contained 17.1% of public charging points.
This closely matches the 17.5% of residents living rurally. These figures are vital for planning.
They guide how future charging infrastructure is distributed. The goal is equitable access for every driver across the nation.
Different Journey Types and Charging Locations
Not all power points serve the same function. Their placement matches specific journey needs perfectly.
This logical categorisation helps you find the right spot for your vehicle. It considers how long you plan to stay.
Destination, On-Street and En-Route Classifications
Destination points are the most common type. They make up over half of all available units.
You will typically use these while your car is parked for a while. Think shopping centres, leisure centres, or hotels.
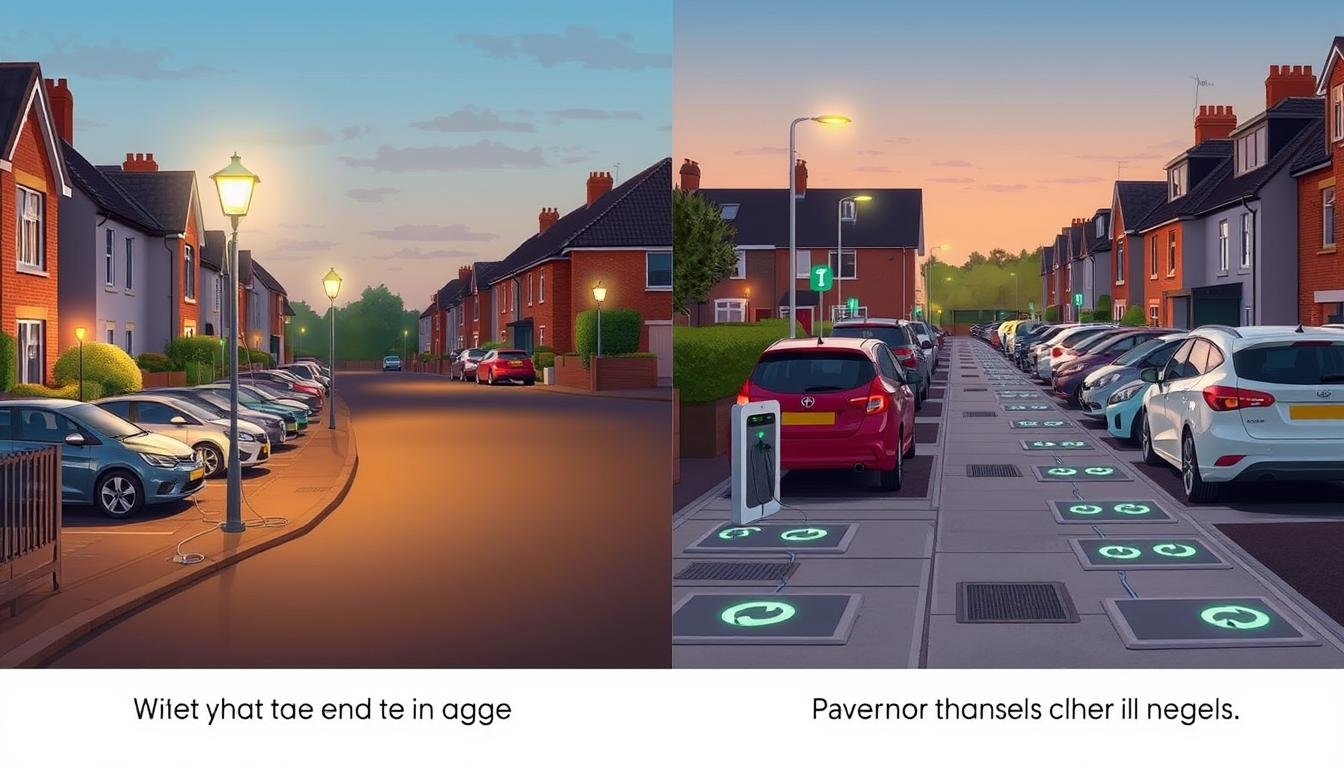
On-street chargers form a vital part of the network. They provide essential public charging for homes without private parking.
This category supports daily urban life. It allows residents to power up near where they live.
En-route locations are designed for longer trips. They are found at motorway services and major trunk roads.
Their purpose is to get you back on the road quickly. They represent a smaller, but critical, part of the system.
A final group covers other semi-public spots. These include workplace car parks and dealership forecourts.
I find these classifications incredibly useful for trip planning. They let you match your stop with the right charging speed.
Knowing the mix helps manage expectations. You can plan where to top up your car with confidence.
Government Regulations and Reporting Standards
Clear rules are essential for building trust in any new technology, and the electric vehicle sector is no exception. I find that consistent government standards are the backbone of a reliable national infrastructure. They ensure everyone plays by the same rulebook.
This framework guarantees the data you rely on is accurate and up-to-date. It transforms how we understand network growth and availability.
Public Charge Point Regulations 2023
A key piece of legislation is the Public Charge Point Regulations 2023. These rules mandate open data for every public power unit.
This means each public charge point must share its location and status. The charge point regulations create a robust system for tracking our national network.
Compliance ensures every charge point is visible to apps and services. Drivers can now find available spots with far greater confidence.
OCPI Compliance and Data Quality Assurance
To meet these charge point regulations, the industry widely adopted the OCPI protocol. This technical standard allows different systems to talk to each other.
Operators use it to share real-time information about each public charge point. This live data flow is crucial for journey planning.
The protocol enforces consistent data quality. It makes sure the status of a charge point you see on your phone matches reality.
I am confident these government standards will keep improving our infrastructure data. Reliable information is the first step towards a seamless driver experience.
Industry Impact and Future Growth of EV Infrastructure
Forecasts for the coming years paint a picture of significant expansion in necessary facilities. The entire sector is mobilising to meet this challenge. This effort will shape how we all travel.
Forecasting Demand for 2030
The Department for Transport revised its outlook in 2024. It projected a need for 250,000 to 550,000 public charging points by 2030.
This growth in infrastructure is vital. It must keep pace with the rising number of electric vehicles on our roads.
I must stress this figure is a projection, not a formal target. It is based on expected adoption rates for EVs.
The industry is actively expanding the charging network. The goal is to ensure every driver has convenient access.
Ongoing investment in our national infrastructure remains the crucial factor. The mix of private and commercial vehicles will affect demand.
Widespread use of EVs depends on this infrastructure rollout. It will determine the success of the transport transition.
| Adoption Scenario | Projected Units by 2030 | Primary Influence |
|---|---|---|
| Moderate Growth | 250,000 | Current policy support |
| High Adoption | 550,000 | Consumer shift & technology cost |
| Market-Led Expansion | 400,000 (approx.) | Private sector investment |
This table illustrates how different factors could influence the final count. The actual number will depend on many variables.
How to Interpret the Latest Charging Infrastructure Statistics
Interpreting the latest figures on our national refuelling network requires a keen eye for detail and an understanding of the data's context. I find that the official charging infrastructure statistics offer a wealth of information, but knowing how to read them is key.
Understanding Graphs and Charts
When you view the graphs, focus on the trend lines rather than single points. The number of units can rise and fall each quarter.
This fluctuation often reflects quality revisions or older units being removed. I recommend checking the government page for visual guides that explain each chart.
Pay attention to the scale used on the axes. It can dramatically affect how growth appears over time.
Noting Data Revisions and Updates
Historical data is sometimes corrected. For example, figures for 2023 and 2024 were revised in February 2026 after a production error.
Always look for notes on the information page about such updates. The reported number represents a net increase, accounting for new installations and removals.
By reviewing these charging infrastructure statistics regularly, you gain a clearer picture of network evolution. This practice helps you understand long-term growth patterns in the number of available points.
I suggest visiting the official website each time you seek the latest figures. The charging infrastructure statistics are updated quarterly, providing fresh insights.
Conclusion
This guide has equipped you with the knowledge to interpret the modern refuelling network confidently. The shift in reporting offers a much clearer picture of true public capacity for your vehicle. Understanding the updated power categories helps you manage your battery and plan stops more effectively.
The government and industry are firmly committed to expanding this vital infrastructure. I encourage you to use the official Department for Transport resources to stay informed on this growth. Their data is key to tracking progress towards future demand.
These improvements mean every public charge point is becoming more reliable and simpler to use. Whether at destination or en-route locations, you can now engage with the network with greater ease. Thank you for reading; I hope this information helps you navigate the evolving landscape of electric vehicle charging with confidence.