Zapmap, the leading service for electric vehicle data, tracks nearly four million charge sessions each month. This vast dataset provides an independent picture of what motorists are actually paying across the public charging network.
I have compiled this report to help every electric car owner navigate the complex landscape of public charging costs. The goal is to cut through the confusion and deliver clear, actionable insights.
As the number of chargers increases rapidly across the United Kingdom, I am tracking how the cost of a session fluctuates for drivers. This constant change makes it difficult to find consistent value.
My analysis of the data reveals a key insight. While some networks remain expensive, specific operators offer surprisingly competitive rates that benefit the average car owner.
Understanding the cost per kilowatt-hour is essential. Whether you charge at home or use public points, this knowledge helps you manage your monthly energy budget effectively.
In the following sections, I will explore which networks provide the best value. My aim is to ensure your next charge is both convenient and affordable for your vehicle.
Key Takeaways
- Independent data from Zapmap provides a reliable picture of public charging costs.
- The public charging network is expanding rapidly across the country.
- Prices for topping up your battery can vary significantly between different operators.
- Identifying networks with rates below a key threshold can lead to substantial savings.
- Knowledge of per-unit energy costs is crucial for managing monthly motoring expenses.
- This analysis focuses on delivering clear, actionable information for drivers.
- The goal is to ensure your next top-up is both convenient and economical.
Understanding the EV Charging Landscape in the United Kingdom
A quiet revolution has reshaped how drivers access energy for their vehicles across the United Kingdom. The infrastructure for powering an electric car is no longer a niche concern.
It has become a mainstream part of our transport system. This shift is fundamental for every motorist considering a switch.
My observations on market evolution and charger surges
Over the past few years, I have watched a significant surge in public charge points. Both the number and variety available have expanded dramatically.
This evolution is critical for mass adoption. Everyday drivers need confidence they can top up easily.
The table below illustrates this growth in available options.
| Year | Rapid/Ultra-rapid Points | Standard/Slow Points | Total Estimated Points |
|---|---|---|---|
| 2020 | ~5,000 | ~25,000 | ~30,000 |
| 2022 | ~8,500 | ~35,000 | ~43,500 |
| 2024 | ~15,000 | ~50,000 | ~65,000 |
My research indicates this expansion provides a more stable environment. It helps those who need to charge an electric vehicle battery away from home.
The role of public charging in the UK’s EV growth
Public infrastructure plays a vital role in supporting the nation's shift. Not every driver has access to a private home unit.
In April 2022, the government announced plans to ensure rapid chargers work 99% of the time. This target prioritises reliability for all motorists.
As more vehicles hit the road, the availability of a dependable point becomes the primary concern. The network is maturing to meet this demand.
This progress supports the broader goal of sustainable transport. It makes owning an electric car a practical choice for more people.
Public Charging Trends and Cost Analysis
The landscape for topping up a battery away from home is constantly evolving, driven by competition and transparent monitoring. My analysis focuses on the data revealing these trends and the forces that shape what motorists pay.
Examining data from Zapmap and RAC initiatives
Reliable insights begin with solid data. Zapmap tracks nearly four million monthly sessions, giving me a clear picture of the real-world expense of using public charge points.
Complementing this, the RAC's Charge Watch initiative specifically monitors the average cost at rapid ultra-rapid chargers. Together, these resources work to ensure drivers are informed and not overpaying for their energy.
How competitive pressures and promotions influence rates
I have observed that market rivalry directly benefits users. Competitive pressures and promotional deals frequently lower the final costs for many people.
It's also crucial to consider connection time, which can influence the bill on faster units. My review of electric car trends shows a market that is slowly stabilising for everyone's benefit.
EV charging price index UK 50p kWh: A Detailed Breakdown
Finding value requires a close look at the numbers, which paint a vivid picture of the market's structure. My detailed breakdown separates the averages from the specific offers, giving you a clearer financial view.
Insights from past data and current network pricing
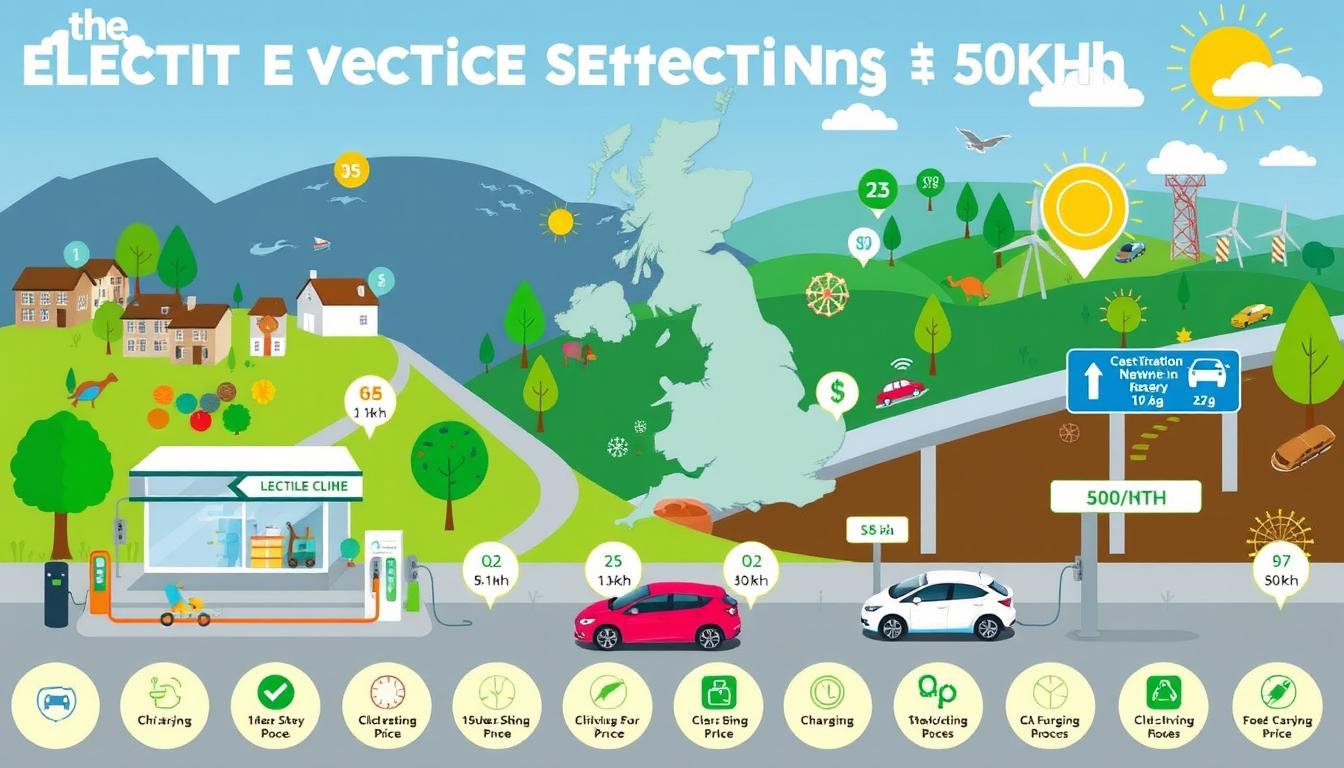
My analysis of recent figures provides a solid benchmark. In March 2026, the weighted average pay-as-you-go tariff for a standard unit was 54p per kilowatt-hour.
For rapid and ultra-rapid equipment, this average rose significantly to 76p. This gap highlights a core truth for every motorist.
The expense of powering your electric car depends heavily on the speed of the charger you select. Each operator has a unique commercial strategy, directly affecting what drivers pay at the point of use.
It is evident that the rapid ultra-rapid segment commands a premium. By understanding these costs, you can identify which network aligns best with your journey needs and monthly budget.
Comparing Public and Home Charging Costs
My analysis reveals a stark divide in expenses based purely on where you choose to replenish your battery. This comparison is vital for managing your motoring budget effectively.
My review of charging costs at public rapid and ultra-rapid points
Using a public rapid ultra-rapid chargers network is convenient for longer journeys. My review of the data shows these sessions come at a premium.
For a typical electric car with a 64.8kWh battery, adding 52kWh of energy is common. At an average rate of 76p per unit, this single top-up costs around £39.50.
Cost benefits of home charging under off-peak tariffs
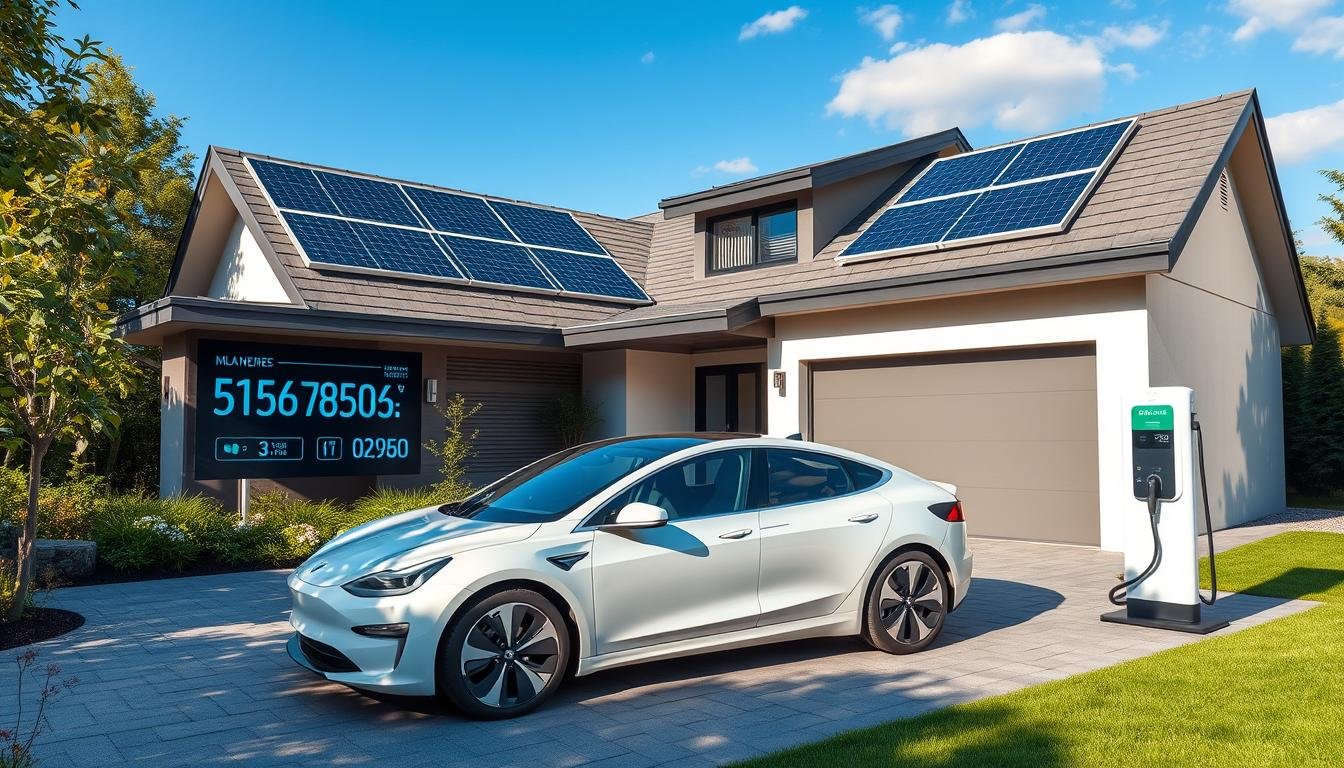
The financial picture changes completely at your driveway. An off-peak domestic tariff can be as low as 9.7p per kilowatt-hour.
Filling the same 52kWh costs just over £5. The table below illustrates this dramatic difference in charging costs and the resulting pence per mile.
| Charging Location | Cost per 52kWh Session | Estimated Cost per Mile* |
|---|---|---|
| Public Rapid/Ultra-rapid | £39.52 | 19p |
| Home (Off-peak Tariff) | £5.04 | 2.4p |
*Based on an efficiency of 4 miles per kWh.
When I compare this to running a petrol diesel car, the annual savings from home charging are clear. They often reach hundreds of pounds.
Driving an electric car is most economical when you power it overnight. While public road trips require faster units, your primary savings start at home.
Insights on Pricing from Various Charging Networks
My evaluation of network-specific data highlights where drivers can find genuine value amidst a crowded market. A detailed look at operator tariffs is essential for this.
Evaluating value from Tesla, Believ, and other operators
I have found that Tesla provides excellent value. Their Superchargers average 57p per kWh for all motorists, but just 41p for Tesla owners.
Operators like Believ are also competitive, offering a rate of 66p. My research into established firms like Radius, with 36 years of experience, shows that choosing the right provider is vital.
The table below compares sample tariffs and illustrates the typical price gap between charger types.
| Network / Charger Type | Example Tariff (p/kWh) | Key Note |
|---|---|---|
| Tesla Supercharger (All Drivers) | 57p | Open to various electric car models |
| Tesla Supercharger (Tesla Owners) | 41p | Substantial saving for brand loyalty |
| Believ (Rapid) | 66p | Competitive rate for public charge points |
| Typical Standard Charger | ~45p | Often lower cost, but slower for your vehicle |
Differences in pricing between rapid and standard chargers
There is a distinct difference in price between a standard unit and a rapid ultra-rapid one. This directly impacts the total cost for every journey.
As the table shows, faster chargers command a premium for convenience. I recommend that drivers compare the prices of each network closely.
This ensures you get the best deal for your needs and keeps your motoring costs manageable.
Evaluating the Impact on Electric Vehicle Drivers
Calculating pence per mile offers a powerful lens to view the true expense of different vehicles. This metric cuts through complex tariffs to show what each journey really costs. For motorists, it transforms abstract numbers into practical budgeting tools.
My focus here is on the direct financial effect for anyone behind the wheel. The choices you make about where and how to power your car have lasting consequences.
Understanding cost per mile and overall journey costs
The average running cost for an electric car is significantly lower than for a petrol or diesel model over many years. This is the core financial advantage. To illustrate, I have compiled a comparison based on typical usage.
| Vehicle & Power Source | Estimated Cost per Mile | Annual Fuel Cost (10,000 miles) |
|---|---|---|
| Electric Car (Home Charging) | 2.4p | £240 |
| Electric Car (Public Rapid) | 19p | £1,900 |
| Petrol/Diesel Car | 20p - 25p | £2,000 - £2,500 |
This table makes the savings clear. Even when using rapid ultra-rapid chargers for long road journeys, the overall expense often remains competitive. Smart drivers minimise use of the most expensive public charge points.
My perspective on long-term savings versus ICE vehicles
I believe the long-term savings of driving an electric car far outweigh the initial costs. Compared to a petrol diesel car, the difference accumulates over thousands of miles.
My perspective is that the transition to electric vehicles is a smart financial move. This holds true provided drivers utilise charging at home whenever possible. The range of savings increases with efficient energy use.
Over five to seven years, the total cost of ownership often tips decisively in favour of electric models. This calculation includes both energy and maintenance. It represents a fundamental shift in how we budget for personal transport.
Conclusion
Substantial savings are within reach for every motorist who makes informed choices. My analysis shows that while public charging costs vary, you can keep your electric car running economically.
Prioritising home charging is the most effective step. Combining this with efficient public networks unlocks significant benefits for all drivers.
I encourage you to monitor energy price trends and select your chargers wisely. This ensures you always get the best value for your vehicle.
Whether you currently drive a petrol or diesel car, switching is becoming more affordable. My final advice is to stay informed about the latest costs.
This way, you can continue to enjoy the advantages of your electric car for years to come.