Did you know that refuelling your battery at a public fast point can cost over 40% more than a standard home session? This significant difference often catches motorists by surprise.
Organisations like the RAC track these expenses through their Charge Watch initiative. They monitor average pay-as-you-go figures, providing valuable insights for drivers.
I explore the reasons behind this price disparity. My analysis looks at the underlying economic factors that make a fast top-up more expensive.
The infrastructure for quicker refills has grown to support drivers on longer journeys. However, the price of electricity plays a crucial role in the final bill.
This guide offers a comprehensive look at these financial and technical differences. My aim is to help you make smarter decisions about your vehicle's energy use.
Key Takeaways
- Public fast charging for an electric car typically carries a substantial price premium.
- The RAC's Charge Watch service analyses real-world refuelling costs.
- Economic and infrastructure investments influence the final price you pay.
- Electricity market prices directly affect the cost of each session.
- Understanding the difference between charging methods can lead to significant savings.
- The network for rapid top-ups is expanding to meet driver demand.
Introduction
The journey to electrified transport brings new considerations for managing energy expenses. For owners of an electric vehicle, the public network for topping up presents a complex puzzle. Understanding its nuances is essential for financial planning.
Initiatives like the RAC's Charge Watch aim to bring clarity. This service was launched to ensure motorists pay a fair price at public points without needing a subscription. It analyses real-world data to protect consumers.
The process of a fast top-up differs significantly from a standard home session. This technical divergence directly impacts the final price you pay to charge your car on longer journeys. My goal here is to demystify this landscape.
I want to equip you with the knowledge to manage your outlays effectively. The shift away from petrol stations requires a reliable and extensive infrastructure. This transition is at the heart of today's motoring evolution.
This introduction lays the groundwork for a detailed breakdown. We will explore the economic and technical factors behind the current pricing metrics. A clear understanding empowers every driver to make smarter choices.
UK EV Charging Landscape and Cost Analysis
For a significant portion of the population, the ability to plug in at home is simply not an option. This makes the public infrastructure for topping up an electric car absolutely essential for daily travel. My research confirms that reliance on this network is a reality for millions of motorists.
Organisations like the RAC address this through initiatives such as Charge Watch. This service tracks price changes over time. Its goal is to ensure drivers get a fair deal when using public points.
The availability of reliable chargers is not uniform. I examined how this influences the overall expense to charge an electric car in different areas. Urban centres often have a denser network, while rural regions can face a scarcity of convenient points.
A fit-for-purpose system is crucial. It should allow a driver to charge their car without needing a specific operator's subscription. This freedom of choice is a key advantage for consumer fairness and network growth.
| Region | Public Charger Density (per 100k population) | Notable Price Variation? |
|---|---|---|
| London | High | Generally more competitive |
| South West | Medium | Moderate, some premium locations |
| North East | Lower | Higher potential for premium rates |
The market has developed significantly to support the increasing number of users. This overview shows a landscape where access and value are directly shaped by infrastructure rollout. Understanding this helps drivers navigate their options more effectively.
Understanding EV Charging Infrastructure
A reliable grid of power points forms the critical backbone for electric mobility to flourish. This system must cater to diverse needs, from daily commutes to long-distance travel.
Rapid and Ultra-Rapid Chargers
I explore the technical distinction between different fast top-up solutions. The most powerful units can deliver energy at rates up to 400 kW to your electric car.
This allows for significantly shorter waiting times during journeys. The table below clarifies the key differences between these two categories.
| Type | Power Output (kW) | Primary Use Case | Common Connector |
|---|---|---|---|
| Rapid Chargers | 50 - 150 | En-route top-ups for shorter stops | CCS, CHAdeMO |
| Ultra-Rapid Chargers | 150 - 400 | Long-distance journey support | CCS (Combo 2) |
Government Initiatives and Network Reliability
My review of government policy highlights a significant move. In April 2022, officials mandated that rapid chargers must maintain 99% reliability for drivers.
This focus on uptime is crucial for user confidence. A dependable network is vital for those relying on public charging points for longer trips.
The expansion and robustness of this infrastructure directly influence the total expense to power a vehicle. I detail how authorities are working to improve access for every motorist.
Insights into mode 4 rapid charging cost UK
Network operators like bp pulse offer tiered pricing that rewards regular users. A full subscription costs £7.85 monthly. This provides access to lower on-the-go rates.
I examine the pricing structure. Subscribers pay £0.69 per kWh for ultra-fast power. Pay-as-you-go rates are significantly higher for the same service.
My analysis shows the expense to power an electric car varies. It depends on whether you use a subscription or contactless payment. The specific provider and chosen unit type also influence the final bill.
You can begin a session using the bp pulse app. This helps manage your energy outlay more effectively. The app locates available points and shows live prices.
Different rates apply across the public network. Fast units often command a premium over slower charging points. The table below details a typical bp pulse tariff structure.
| Charger Type | Power Output | Subscriber Rate (£/kWh) | Pay-As-You-Go Rate (£/kWh) |
|---|---|---|---|
| Ultra-Fast DC | 150kW+ | £0.69 | £0.79 |
| Fast DC | 50kW | £0.59 | £0.69 |
| Fast AC | 7-22kW | £0.49 | £0.59 |
This comparison highlights the potential savings. Choosing the right plan is crucial for controlling the cost of charging your vehicle.
Comparing Mode 4 and Mode 3 Charging Methods
The two primary methods for topping up an electric car's battery offer vastly different experiences for drivers. Selecting the right one involves a trade-off between speed and your final bill.
I will break down the key distinctions. This helps you make an informed choice every time you need to plug in.
Technical Differences and Charging Speeds
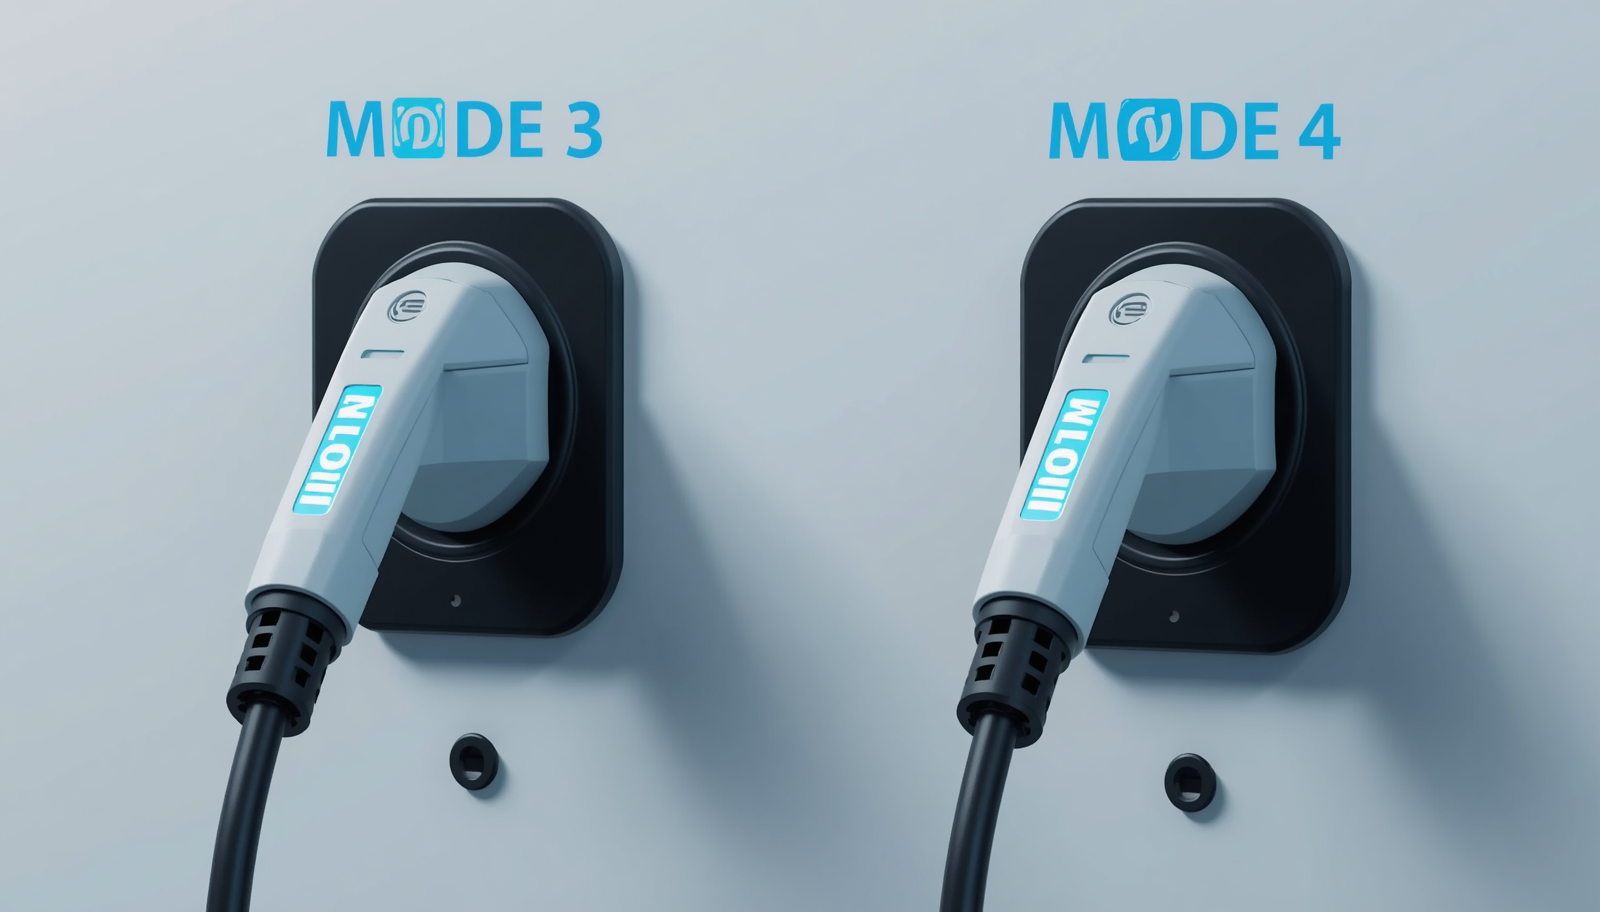
The standard Mode 3 method uses alternating current (AC). It typically delivers power at 7kW to 22kW.
This is common for home units and many public charging points. It's a slower process, often taking several hours.
The faster Mode 4 system uses direct current (DC). These high-power units can operate at 50kW or much more.
This direct feed allows for a much quicker top-up. You can add significant range in under thirty minutes.
Cost Implications and Efficiency
The convenience of a faster session comes with a higher price per kWh. Network tariffs clearly reflect this premium.
For example, a guest user at a bp pulse point pays £0.44 per kWh for a 7kW AC charger. The rate for a 150kW DC ultra-fast charger is £0.89.
| Charger Type | Power Output | Guest Rate (£/kWh) |
|---|---|---|
| AC Fast | 7kW | £0.44 |
| DC Ultra-Fast | 150kW | £0.89 |
Your vehicle's efficiency can also be affected. The total expense to charge your electric car isn't just about the unit rate.
Time spent at the charging points is a valuable factor. A quicker session may justify a higher cost on a long journey.
Understanding this balance is key to managing your motoring costs effectively.
Impact of Battery Size and Charging Time on Costs
How much you pay to power your vehicle is directly tied to the size of its battery pack. The larger the capacity, the more electricity it needs for a full session.
This relationship is a key driver of your final bill. I will explore how both physical capacity and session length shape your expenses.
Battery Health and Optimising Charge Cycles
Manufacturers often advise charging your electric car battery only to 80%. This practice helps maintain long-term health.
It also optimises the charging rate near the top. Following this guidance can extend the life of your vehicle's most expensive component.
My calculations use the RAC's standard 64.8 kWh battery. Charging it from 10% to 80% requires about 52 kWh of energy.
At current tariffs, this translates to roughly £40. This figure clearly shows the direct link between capacity and outlay.
Influence of Charge Duration on Price
The length of your session also affects the total price. Using a high-power, expensive unit for a long time increases costs sharply.
A bigger battery naturally needs more time to replenish. This duration multiplies the per-kWh rate you pay at public charging points.
Optimising your charge cycles means balancing speed with battery care. Smart planning can help you manage the costs of running an electric car.
| Battery Size (kWh) | Energy Required (10-80%) | Approximate Cost* (£) |
|---|---|---|
| 40 | ~36 kWh | £27.00 |
| 64.8 | ~52 kWh | £39.00 |
| 100 | ~80 kWh | £60.00 |
*Cost estimate based on a sample rate of £0.75 per kWh at a high-power public charger.
Historical Trends in EV Charging Tariffs
Analysing past pricing data shows a clear link between what you pay at a public point and wholesale energy. I review how tariffs for your electric car have changed over time.
This history is crucial for understanding today's market. It explains why the cost to charge an electric vehicle varies so much.
Fluctuations in Wholesale Electricity Costs
A significant shift occurred from September 2022. The expense of using public chargers surged due to soaring wholesale electricity costs.
This increase was driven by global market pressures. It directly raised the price per kWh at many charging points.
My analysis notes that these higher rates plateaued through late 2023. The cost to charge did not fall immediately when wholesale prices began to soften.
There is often a lag before savings are passed to the driver. Network operators must manage their own long-term energy contracts.
The volatility of wholesale costs has a direct impact. It shapes the final bill you receive after a public charging session.
This relationship is summarised in the table below. It shows how different wholesale periods influenced typical public charger rates.
| Time Period | Wholesale Price Trend | Typical Public Charger Rate (£/kWh) |
|---|---|---|
| Pre-Sept 2022 | Relatively Stable | £0.35 - £0.45 |
| Sept 2022 - 2023 | Sharp Increase | £0.55 - £0.75 |
| Late 2023 Onwards | Gradual Decline / Plateau | £0.65 - £0.80 |
These historical fluctuations have shaped the current landscape. They explain the baseline for today's cost of charging electric vehicles on the go.
Economic Implications for Electric Car Drivers
The financial reality of running an electric vehicle hinges on a simple calculation: cost per mile. My analysis breaks this down to help you understand your true expenditure.
Cost per Mile Comparisons
I assume an average efficiency of 3.5 miles per kWh for your electric car. This figure is key for all my calculations.
To find your cost per mile, divide your electricity rate by 3.5. For example, a home tariff of 24p per kWh gives a cost of just under 7p per mile.
This is significantly lower than a typical petrol car. The table below shows a clear comparison.
| Charging Location | Assumed Rate (£/kWh) | Efficiency (miles/kWh) | Cost per Mile (pence) |
|---|---|---|---|
| Home Charging | £0.24 | 3.5 | 6.9p |
| Public Fast Charging | £0.75 | 3.5 | 21.4p |
Public versus Home Charging Expenditure
My research highlights a stark difference. Powering your vehicle at home remains far cheaper than using public points.
The choice between these two options is the most significant factor in managing your total car costs. Your annual spend can vary by hundreds of pounds.
Understanding this helps you make smarter decisions about when to charge your electric car.
Industry and Regulatory Perspectives
The late Quentin Willson's FairCharge campaign represents a major voice for electric car drivers. It was founded to remove barriers to adoption across the country.
I highlight how this group advocates for better standards. Their work focuses on fair pricing and reliable access for every motorist.
FairCharge Campaign and Consumer Advocacy
Consumer groups are working to lower the expense to charge an electric vehicle. FairCharge pushes for transparent tariffs at public charging points.
This advocacy is essential for building driver confidence. It ensures the network grows in a fair and sustainable way.
Standards and Government Policies
The UK's first public electric vehicle charging charter launched in September 2023. This initiative aims to standardise the experience at charging points.
Industry pressure seeks government policies for reliability. These rules will help manage the price and quality of service.
| Initiative | Lead Entity | Key Objective | Launch Date |
|---|---|---|---|
| FairCharge Campaign | Quentin Willson / FairCharge | Advocate for fair pricing and access | Ongoing |
| Public EV Charging Charter | Industry & Government | Improve reliability and user experience | September 2023 |
These regulatory efforts shape the future of the electric car market. They are crucial for a robust network of public chargers.
Practical Strategies to Reduce Charging Expenses
Your driveway holds the key to slashing the expense of running an electric vehicle. I will show you how to make the most of your own power supply.
Maximising Home Charging Benefits
Plugging in at home is the most effective way to lower your bills. As of Spring 2025, a full charge for a 64kWh battery costs a maximum of £17.52 under Ofgem's price cap.
This is far cheaper than using any public charger. To reduce this further, explore specialised energy tariffs from your provider.
Many offer lower rates for overnight power. Scheduling your electric car to charge then can cut your average cost significantly.
Using home energy wisely helps you avoid the higher prices at fast public points. It also gives you more control over your total expenditure.
Improving your vehicle's efficiency extends its range. This means you need to plug in less often, saving money over time.
Always compare different energy providers. A better tariff can lead to major savings on the total cost to charge your electric car.
| Charging Method | Full Charge Cost (64kWh) | Cost per Mile* |
|---|---|---|
| Home Charging (Capped Rate) | £17.52 | ~7p |
| Public Fast Charging (Example) | £48.00 | ~21p |
*Assumes 3.5 miles per kWh efficiency.
Conclusion
To conclude, drivers face a clear trade-off: pay more for speed at public points or save significantly by plugging in at home. I have explored the reasons behind this price difference. It reflects the premium for faster technology and the infrastructure required to support it.
My analysis confirms that while public fast points are vital for longer trips, domestic energy remains the most economical choice for daily use. This guide aimed to provide the insights needed to navigate the evolving landscape of electric vehicles.
By understanding what influences your bill, you can make smarter choices about when and where to power your car. I encourage you to follow industry developments. Advocacy efforts continue to work towards a more affordable and accessible system for all.