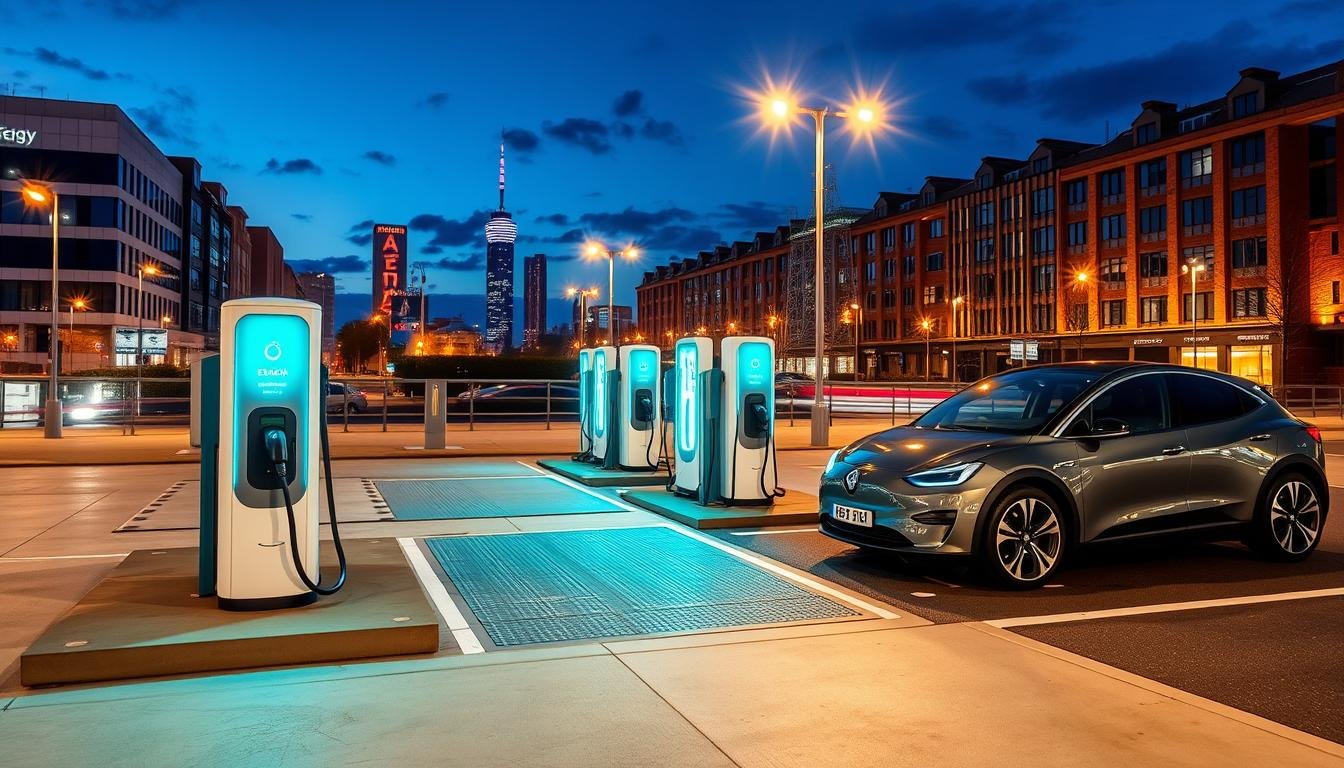
Britain's network of ultra-rapid power points is growing fast, with over a thousand devices now capable of delivering a massive 350kW. Yet, a surprising number of motorists plug in and never see that headline figure on their dashboard.
The disconnect isn't usually the station's fault. Your car's own internal hardware is often the limiting factor, preventing it from accepting the full power available. This creates a gap between expectation and reality for many drivers.
Understanding this technical relationship is crucial. It directly impacts how long you spend at a motorway service station during a long journey. This guide delves into the core reasons why.
I will examine the complex dance between your vehicle's battery management system and the national grid's infrastructure. We'll look at how different technologies interact to determine the actual speed your specific model achieves.
Key Takeaways
- Britain's ultra-rapid charging infrastructure is expanding, but not every car can use it fully.
- A vehicle's internal hardware frequently caps its maximum power intake.
- The battery management system is a critical component in this process.
- Grasping this concept can help you optimise your time on long trips.
- Technical constraints prevent many modern electric vehicles from reaching advertised peak speeds.
- This analysis provides a clear overview for drivers confused by the mismatch.
Understanding the Fundamentals of EV Charging Curves
Imagine your car's battery as a sophisticated container that carefully controls how fast it accepts energy. This control mechanism creates a specific power intake profile, which is far from a simple, constant flow.
Grasping this profile is key to setting realistic expectations for your journey. It explains why you might not always see the maximum power figure advertised for a public station.
What Is a Charging Curve?
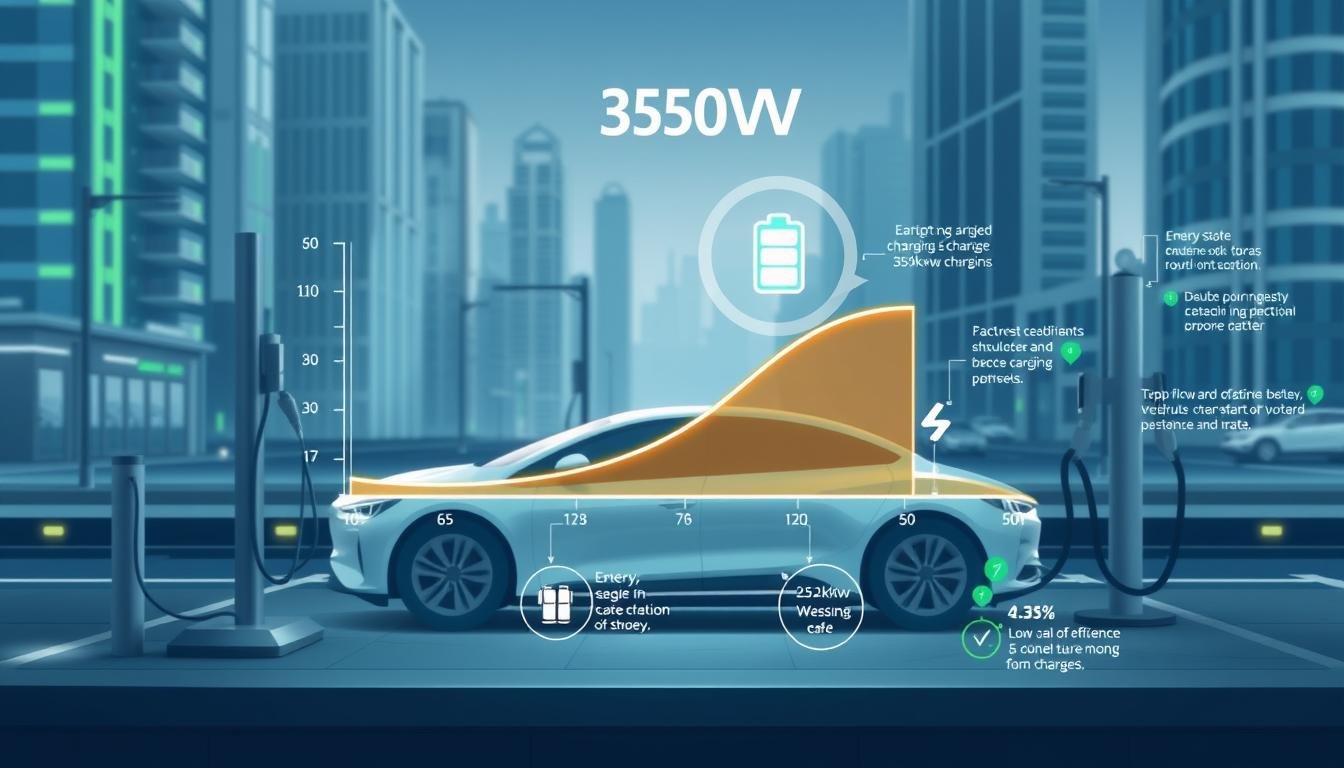
A charging curve is the dynamic pattern dictating how much power your vehicle accepts based on its current state of charge. The car's internal computer constantly adjusts this rate.
It does this to keep the lithium-ion cells within safe temperature limits. The process prevents excessive heat build-up during the high-power phase.
| State of Charge | Typical Power Rate | Primary Purpose |
|---|---|---|
| 0% - 20% | Rapidly increasing | Initial bulk charge |
| 20% - 80% | Peak, sustained power | Fastest replenishment |
| 80% - 100% | Gradually slowing | Protecting battery health |
Why Charging Curves Matter for Battery Health
The deliberate slowdown above 80% capacity is a protective feature. It safeguards the long-term viability of the battery pack by reducing stress.
This is why your charging times are not linear. The final portion takes proportionally longer, which is a design choice for longevity.
By understanding this, you can better plan your stops. You'll know when moving on is more efficient than waiting for a full battery.
Factors Influencing EV Charging Rates
Your car's ability to accept a high power flow is not just about the plug you use. It's fundamentally limited by its own design. I find two main internal factors create this ceiling.
Vehicle’s Maximum Charging Rate and On-board Limitations
Every model has a physical maximum rate set by its on-board charger and electrical architecture. This is a fixed hardware limit.
For example, the Kia EV6 Long Range supports a much higher power intake than a Nissan LEAF. The table below shows this stark difference.
| Model | Maximum DC Rate | Maximum AC Rate |
|---|---|---|
| Kia EV6 Long Range | 235kW | 11kW |
| Nissan LEAF | 46kW | 6.6kW |
Even on the most powerful public unit, a LEAF cannot exceed its 46kW cap. The car's internal wiring and components simply cannot handle more.
The Impact of Battery Management Systems
The battery management system (BMS) acts as an intelligent gatekeeper. It constantly monitors cell temperature and voltage.
Its primary job is to prevent damage. The BMS will dynamically limit the power intake to keep everything within safe parameters.
Therefore, your vehicle's manual holds the key. The specified maximum rate is the ultimate bottleneck for any session.
Decoding the EV charging curve 350kW UK
A common misconception is that powerful public units deliver their maximum output from start to finish. In reality, the power intake fluctuates significantly throughout a session.
For most vehicles, the peak intake occurs when the battery is between 20% and 80% full. After this point, the system deliberately reduces the rate to protect the cells.
The advertised maximum figure is often a theoretical peak. Few models can sustain it for more than a few minutes before throttling begins.
| State of Charge | Typical Power Intake | Phase Description |
|---|---|---|
| 0% - 20% | Rapidly increasing | Initial bulk replenishment |
| 20% - 80% | Sustained peak rate | Window of fastest speed |
| 80% - 100% | Gradually declining | Protective tapering phase |
This staircasing effect is due to the battery management system managing heat and voltage. It ensures long-term battery health by reducing stress at high capacity levels.
Understanding this profile helps you set realistic expectations. You can plan your stops more efficiently, knowing the final portion takes proportionally longer.
Charger Types and Their Power Ratings
Public infrastructure offers a spectrum of power outputs. You have options from gentle overnight top-ups to intense motorway boosts.
I categorise these units into four main groups. Your choice depends on your journey needs and your vehicle's capability.
AC Versus DC Charging: Key Differences
The core difference lies in where the power conversion happens. Alternating Current (AC) conversion occurs inside your car, limited by its on-board charger.
Direct Current (DC) conversion happens in the public unit itself. This bypasses the car's internal limit, allowing for much higher power flow.
Overview of Charger Categories from Slow to Ultra-Rapid
Each category serves a distinct purpose. Fast charging is ideal for public top-ups while shopping. Rapid charging is designed for longer journeys.
Remember, the unit's rating is only one part of the equation. Your car's own hardware sets the final, unbreakable ceiling.
| Charger Type | Power Rating | Primary Use Case |
|---|---|---|
| Slow | 3kW to 7kW | Overnight home charging |
| Fast | 7kW to 25kW | Public destination top-ups |
| Rapid | 50kW to 150kW | En-route travel charging |
| Ultra-Rapid | 150kW to 350kW+ | Minimum stop motorway journeys |
This breakdown helps you match the equipment to your specific needs. Knowing these categories makes planning your stops much simpler.
The Role of Temperature in Charging Performance
One of the most overlooked factors affecting how quickly you can replenish your car's energy is the weather. The ambient temperature directly influences the chemical processes inside your vehicle's power pack.
This has a profound effect on your session's efficiency. I find it's a key reason for inconsistent performance throughout the year.
Effects of Cold Temperatures on Battery Efficiency
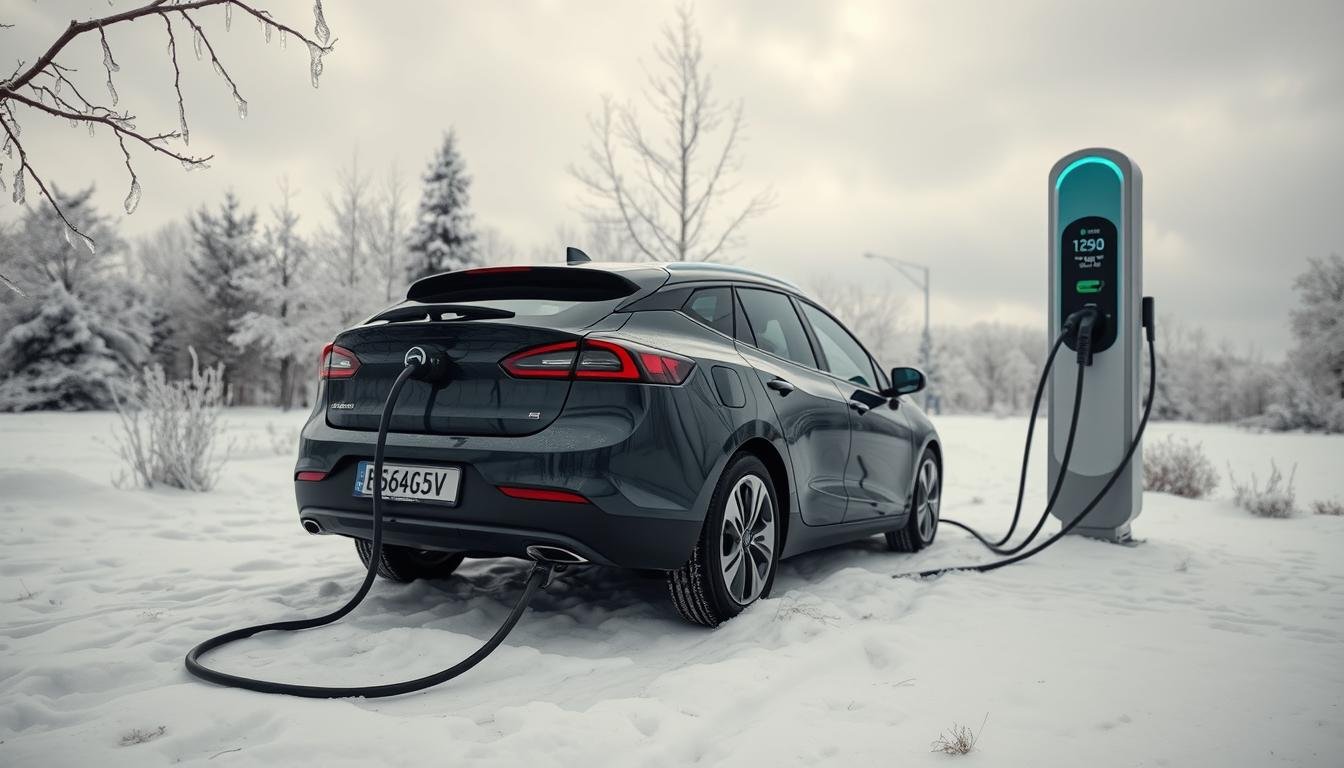
Cold weather significantly slows the chemical reactions within the cells. This increases internal resistance.
The battery management system detects this change. It then lowers the power intake to protect the cells from potential damage.
My analysis confirms that approximately 25 degrees Celsius is the optimal temperature for efficient energy transfer. This ideal is rarely met on a typical cold morning in the UK.
Smart Charging Tips for Colder Days
You can take practical steps to improve your experience. First, try to drive your car for a short while before you plug in.
This uses the motor's heat to warm the battery. A warmer battery accepts a higher rate more readily.
Secondly, plan your session for the warmer part of the day if possible. Understanding these factors helps maintain more consistent charging speeds in our variable climate.
Case Studies: Kia EV6 Long Range and Nissan LEAF
The time you spend at a power point can vary dramatically depending on the specific make and model of your vehicle. I will compare two popular cars to demonstrate this real-world impact.
Their different approaches to power intake show why advertised figures are only part of the story.
Kia EV6: Ultra-Rapid Charging and Limitations
The Kia EV6 Long Range represents modern, high-capability architecture. It can utilise ultra-rapid units effectively.
My analysis shows it achieves a 20-80% replenishment in roughly 16 minutes. This speed is a game-changer for long journeys.
However, its own hardware still sets a ceiling. The peak rate is not sustained for the entire session.
Nissan LEAF: Charging Characteristics and Practical Impacts
Conversely, the Nissan LEAF demonstrates an older technological approach. Its design limits maximum power intake.
Using a 50kW rapid charger, a similar 20-80% session takes about 43 minutes. This has a clear practical effect on trip planning.
You must allocate more time for stops. The car's internal system simply cannot accept a faster flow.
These case studies prove that charging times are dictated by the vehicle. Even on the same rapid chargers, your wait depends on your car's internal design.
Rapid Versus Ultra-Rapid Charging Explained
A significant time-saving decision for any driver is understanding the stark difference between rapid and ultra-rapid power stations. The classification is based purely on the power output the unit can deliver to your vehicle.
Technically, rapid charging refers to units with a maximum output between 50kW and 150kW. Ultra-rapid stations exceed 150kW, with many now capable of over 350kW. This higher power ceiling is what enables dramatically shorter stops.
Comparing Charging Times at Different Power Levels
My analysis of session data reveals a clear time gap. For a typical 20% to 80% battery replenishment, ultra-rapid chargers (150kW+) can complete the task in 10 to 30 minutes.
In contrast, using a standard 50kW rapid charger typically requires 30 to 60 minutes for the same result. This means your wait can be twice as long at a slower unit.
For long journeys, seeking out an ultra-rapid hub is the most effective way to save time on the road. Choosing the right station is a vital part of efficient trip planning.
Analysing Charging Sessions and Data Trends
A deep dive into session logs uncovers the truth about fleeting peak power phases. I regularly examine this data to move beyond manufacturer claims and understand real-world performance.
The patterns revealed are crucial for setting practical expectations. They show how your vehicle's behaviour dictates the stopwatch.
Understanding Peak Charging Rates and Their Duration
My research confirms the highest power intake is a brief event. It is often maintained for mere minutes before the system scales it back.
This reduction is a deliberate safeguard. The battery management system initiates it to prevent excessive heat and preserve cell health.
Consequently, the advertised maximum rate is a snapshot, not a sustained reality. This directly shortens the window for the fastest possible charging times.
How Charge Rate Variability Affects Overall Charging Times
The constant fluctuation in power flow is a defining trend. This variability makes the total session duration difficult to predict precisely.
You might start at a high rate, but a gradual decline soon follows. This stair-step profile means the final portion always takes proportionally longer.
Therefore, your overall time connected is shaped by this designed inconsistency. Knowing this helps you plan a more efficient departure rather than waiting for a full battery.
By examining these data trends, I provide the knowledge to better manage your expectations during every charging session you undertake.
Insights from the BYD Seal Charging Curve
A close look at the BYD Seal's charging profile shows a distinct stair-step pattern in power delivery. This real-world data illustrates how modern manufacturers balance the need for speed with essential battery care.
The Staircasing Phenomenon in Charge Rates
During testing, the Seal achieved a peak power intake of 123kW for just five minutes. My analysis shows it maintained over 120kW until the battery reached 60% capacity.
After that point, the rate dropped in clear, distinct steps. It fell to 48kW once the state of charge hit 85%.
This staircasing is programmed into the car's algorithm. It manages cell heat and voltage stress during a session.
Implications for Battery Longevity and Charging Strategy
This deliberate reduction protects the battery's long-term health. For drivers, it means the fastest replenishment occurs below 80% capacity.
I suggest avoiding a full 100% charge if you want to maintain a high power intake. The final phase is much slower by design.
The case study provides valuable insights. It shows the sophisticated balance between rapid stops and long-term battery preservation.
Best Practices for Maximising Charging Efficiency
You can take control of your waiting time by understanding and applying a set of proven efficiency techniques. Following a few strategic rules improves your vehicle's performance and safeguards its long-term health.
Optimising Charging Sessions for Better Performance
I recommend planning your stops to arrive with a lower state of charge. This triggers a higher power intake from the start.
For daily use, replenishing to around 80% capacity is the sweet spot. It maximises efficiency and protects your battery.
Performing multiple shorter sessions is often better than one long one to 100%. This approach keeps the cells in their optimal high-power zone.
Effective Load Management Techniques
Modern hubs use intelligent load management. Technology, like that in Kempower units, distributes power based on each connected vehicle's demand.
This system helps get the most from shared stations. Seek out chargers that support this dynamic balancing for your car.
Avoiding peak times also ensures you benefit from the full available rate. These strategies collectively reduce your station time and preserve your battery.
Considerations for Home and Public Charging
Owning an electric car successfully hinges on understanding the complementary roles of your driveway socket and en-route power hubs. A smart, two-pronged strategy is the key to convenient and efficient motoring.
For daily use, a dedicated home wallbox is ideal. These units typically provide 7kW of power using AC. This is perfect for overnight top-ups while you sleep.
This slower AC method is also gentler on your battery's long-term health. It's the best way to charge electric vehicles for routine needs.
Choosing the Right Charger for Your EV
Public networks offer a wide spectrum, from 22kW fast units to ultra-rapid hubs. Your car's own maximum intake rate dictates the best match.
My advice is to plan a combined strategy. Use your home charger for daily replenishment. Reserve powerful public chargers for longer journeys.
This approach ensures you always have enough range without unnecessary stress. You optimise both your time and your vehicle's battery life.
Conclusion
Ultimately, your time at a power point is governed by a delicate balance of technology and physics. I've explored the complex factors that dictate this, from your car's internal hardware to the capabilities of motorway service stations.
You now realise that headline speed figures are rarely sustained. Your battery management system and your model's maximum rate are the true governors. This means charging times are not linear, with the final portion often taking many extra minutes.
By understanding these technical realities, you can make smarter choices. Planning your journey around efficient charge stops, rather than a full battery, is key.
I hope this knowledge helps you get back on the road faster, ensuring a smooth and efficient experience with your vehicle.